TLDR: This article is about cost benefit of CX- CX Proof of Value Analysis. An AE firm captured $8.5 million in trapped client revenue, lowered it’s cost of client acquisition, dramatically improved its employee engagement rate, stabilized its proposal/win rate and created an employment brand that has virtually eliminated its recruitment challenges, all by implementing a strategic client experience (CX) management program.
If you are in an A/E/C firm, let’s say an Architecture/Engineering company in the US, and you are not actively managing a firm-wide client experience program, it’s very likely that you have been leaving millions of dollars on the table each year for a long, long time — and your firm is working a lot harder (not smarter) for that net labor multiplier. In fact, your cost of marketing, cost of sales, operating margin, referral rate, revenue/FTE, client churn and employee turnover are also likely taking a hit, despite firm growth, as you continue to pull out of the worst recession in 100 years. It’s likely you’re working a lot harder to replace revenue than is necessary — while there’s a way to address this, which is standing right in front of you, staring you in the face.
Let’s say your firm is growing and revenue is up — margins aren’t bad. All financial indicators are showing positive results. There are possibly one or two indicators that you’d like to see improve (win-rate and recruiting costs), but all-in all, things are pretty good — relative to where they’ve been over the past decade. Why fix what isn’t broken, and is, for most intents and purposes, trending north? The question is, how much energy are you using to chart this progress, and what’s likely happening competitively that can impact or even imperil your progress?
In 2017, we began working with a firm that was determined to figure this out. Their president was tenacious and brilliant, to put it mildly — which are two characteristics that seem increasingly common among E-firm leaders. He knew they were in their own way. He knew they weren’t seeing growth to meet their potential. He also had just attended a conference several months earlier where our firm was speaking about the economics of managed client experience programs — where we met.
Fast forward several months. We were in their HQ presenting our initial analysis of client segment-based feedback along with client lifetime value (CLV) and preparing for the next stage where we would be incorporating analysis on baseline client feedback to determine strategies for setting their CX approach and prioritizing their CX budget.

The firm had 695 client records meaning in the past several years they had done thousands of projects for 695 commissioning entities. Of the 695, we segmented them into three categories based on their CLV (the economic value of the client relationship over an anticipated lifetime duration).
- High-value — The average CLV in this segment was $250,000 across 215 clients.
- Mid-value — The average CLV in this segment was $150,000 across 355 clients.
- Low-value — The average CLV in this segment was $75,000 across 125 clients.
Once we had the segmentation done by average CLV, the firm immediately stood on a better foundation to evaluate the weight of client feedback relative to their value back to the firm. Our next step was to go back into the client feedback data and associate issues and complaints based on their segment. The following numbers include issues surfaced by both the firm and the client. An example issue is a missed deadline the firm reported to the client.

Of the High-Value segment, the law of averages played itself out. For a segment of 215 clients, about 75% (150 clients) appeared to be satisfied — meaning an issue or complaint was never noticed, identified or articulated by either the client or the firm. Later, we’d find out our reliable law of averages was actually hiding some very important and expensive realities. In this segment 30 percent, or about 65 client took the time and effort to voice a complaint or issue to the firm.
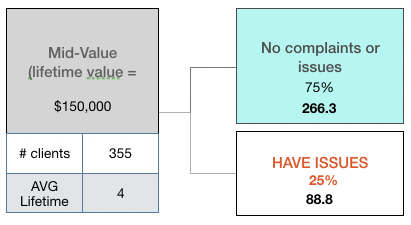
Of the Mid-Value segment, we noticed a slight increase in the number of clients who appeared to be satisfied (75% or 266 clients) or who never articulated an issue or complaint. Of the 355 clients in this segment, roughly 89 clients had an issue of some kind in the services the firm provided. Again, issues tracked are surfaced by either the client or the firm. This number, we’d later find out, was obscuring a troubling reality and that the number of issues or complaints were higher than what was evident.

Of the Low-Value segment, we found an increased percentage of clients who voiced issues or complaints (65% or 81 clients). We pointed out to the firm that this is common in lower-value segments based on our experience, to which they agreed — often the lower the segment’s economic value, the higher the rate of complaints or issues. In fact one of the reasons for the lower CLV in this segment is the rate of issues or complaints relative to the project revenue. These are lower-value relationships because the lifetime duration is lower (3.75 years vs. 5 years for the higher-value segment) the revenue is lower and yet the rate of issues and complaints is higher as a percentage of overall projects managed.
Next, we analyzed Issue/Complaint Behavior and Issue/Complaint Handling trends in the firm for each of the three segments to determine issue volume relative to segment size and value back to the firm. In this illustration, only 14.2 clients (22% of the 64.5 of those who had a found issue in this segment) voiced an issue or complaint. This means that of the known issues, only 22% were voiced by the client.
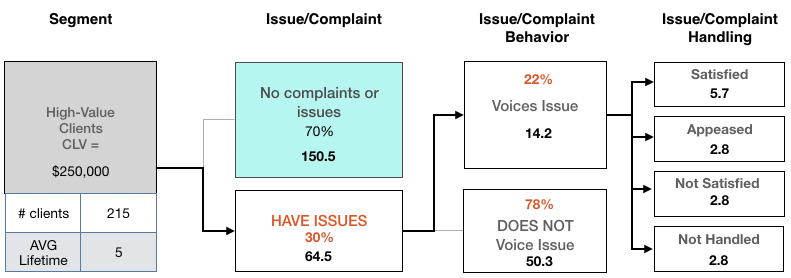
The other 50 clients (78% of the High-Value segment) had an issue that NOT voiced by the client. It was an issue that the either the firm noticed and tried to resolve or it went unchecked altogether — as is typically found later in project postmortems, when it’s too late to resolve when it matters most. In the above illustration, we see that there are four possible outcomes for every client-articulated issue (satisfied, appeased, not satisfied, or not handled).
- Satisfied means the issue was raised by the client and was resolved to the client’s satisfaction.
- Appeased means the issue was raised by the client and was dealt with in a way that the client was appeased, meaning it could have been better but is no longer a show-stopper.
- Not Satisfied means the the issue was raised by the client and was not resolved to the client’s liking or satisfaction. They believe a better course of resolution could have been made but choose to move forward.
- Not Handled means the issue was raised by the client and was either ignored by the firm or was never resolved with an attempt the client felt was adequate.
In this High-Value segment above, we see that following the law of averages, 40 percent of the issues that were brought to the firm’s attention were resolved in a way that satisfied the client. Of the 60 percent of remaining voiced issues 20 percent each fell into the other three categories.
Below, we see the Mid-Value segment’s Issue/Complaint Behavior and Issue/Complaint Handling trends. It is notable that only nine percent of the firm’s clients voiced an issue when an issue arose. This means that nine times out of ten, the client is choosing not to seek a resolution to an issue or a complaint. They are consciously deciding not to solve a problem between themselves and the firm. This is where poor client experiences are hidden and the number one cause of client churn over time. This also means the firm is not given the opportunity to resolve an issue that will almost certainly affect the perceived value of the relationship the client has with the firm.
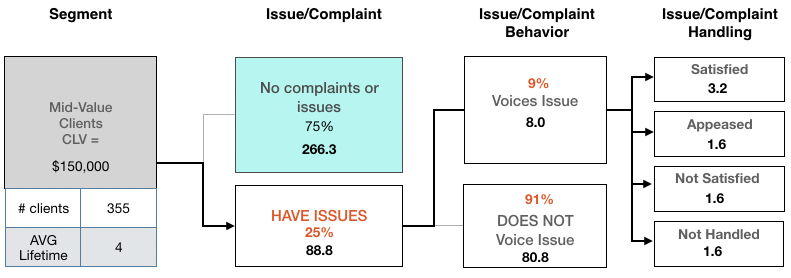
If you do the long math on this, you will see that of the 88.8 clients in the Mid-Value segment who experienced an issue or had a complaint, only 3.2 of them ended up being satisfied in the final analysis. As surprising as it may seem, only four percent of clients who had an issue ended up being satisfied by a firm resolution. This is not so much a function of the firm being bad at issue resolution — they’re designers and engineers for God’s sake — arguably the world’s best problem-solvers. No, instead, it’s a function of the firm not having visibility into the fact the client had an issue or complaint in the first place. It turns out, as we could have guessed, the firm is bad at mind-reading. The firm only has an opportunity to resolve issues that are articulated to them.
You may be asking, “Wait, how did you know about unarticulated/unvoiced issues or complaints from the client?” The answer is, through a series of client interviews and extrapolation. This is not an exact science — but as we work with our client firms and interview their clients as objective, impartial, outside counsel we are able to uncover a lot through strategically asked questions. For example, as you will see in the table below, we go far beyond the basic and formulaic NPS questions to learn a lot more about clients’ attitudes and motivations as a result of the firm’s services and issue/complaint handling.
For each of the High-Value, Mid-Value, and Low-Value segments of this firm we asked at least 28% (194 half-hour client interviews over 45 days!) of the firm’s clients (past and present) the following questions:
- “Have you experienced any known issues with the firm across this past project?
- “Of the known issues/complaints you had with the firm’s service, how many of them went unvoiced — meaning you decided not to bring them up to the firm?”
- “For those issues/complaints that went unvoiced, why did you choose not to voice them to the firm?”
- “From 1–100 how satisfied are you with the firm, today?”
- “Regarding future projects should the need arise, how likely are you to remain with this firm?”
- “From 1–100, how likely would you be to recommend this firm to colleague or friend with similar needs as yours, given your experiences to date, and why?”
- “From 1–100, given your experiences to date with this firm, how likely are you to explore other competitive or alternative firms providing similar services, for future projects should the need arise?”
- “From 1–100, given your experiences to date with this firm, how likely are you to go with a competing firm providing similar services, for future projects should the need arise, and why?”
- “From 1–100, given your experiences to date with this firm, how likely would you be to explicitly share your experiences to others either directly or indirectly via social media, and why?”
- “What advice would you give the firm’s CEO to ensure you have a better client experience in the future?”
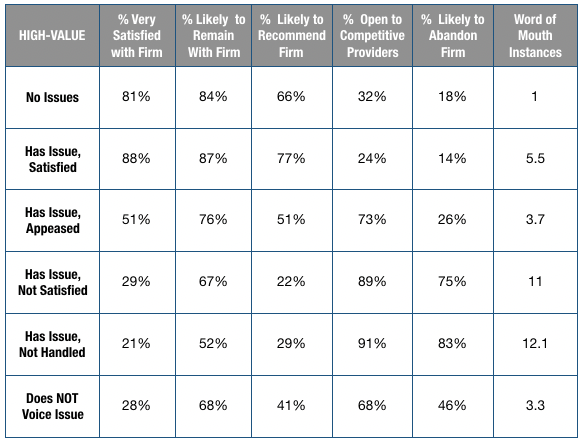
Did you notice:
- Even for the group that had no issues, 32% are open to evaluating competing firm offerings in the future and 18% are likely to abandon the firm with future projects.
- Those with no issues or complaints are, on average six times less likely to share their experience with their networks.
- Those with an issue resulting in a satisfactory resolution are more satisfied with the firm than those who had no issue at all and are five times more likely to share that experience with their network via word of mouth (WOM) than those without an issue or complaint.
- Those with an issue that were either merely appeased or not satisfied with the resolution are 73% and 89%, respectively, likely to shop their future projects with other competing firms — and 75% of those who were not satisfied are likely to leave the firm with future projects.
- Those whose issues were either unsatisfactory or not handled, are likely to share that 11–12 times more with their networks via WOM, either directly or through social media, than if they had no issue at all.
- 68% of those who do not voice their issues or complaints for whatever reason, are open to evaluating other firms and nearly half (46%) are likely to abandon the firm for future projects.
These finding are significant. What it all means is that there is tremendous value in a) finding every opportunity to open transparent communications with your clients; b) not relying on your clients to voice issues if or when they might arise; and c) go the distance to give your clients something positive to say about their experience with the firm.
In the table below, we take the next step, moving from Issue/Complaint Behavior and Issue/Complaint Handling to Issue/Complaint Impact Analysis for the High-Value segment.
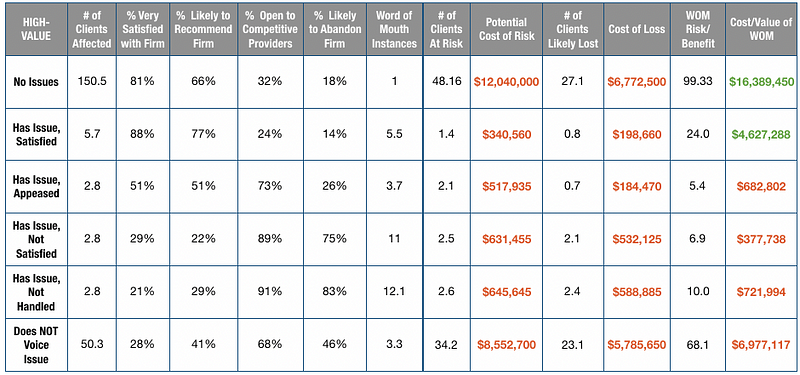
As you can see, there is a lot of data and insights to unpack here:
- The number of clients at risk in the “No Issues” and “Does NOT Voice Issue” categories is several factors higher than the rest because their starting numbers are so much higher (150.5 and 50.3, respectively) — but this also sheds light on another important factor; unarticulated issues are typically a land mine for firms concerned with client experience.
- The firm has a potential Cost of Risk of over $12,000,000 (48 clients multiplied times their CLV of $250K) from a category of clients with no issues. This means that out of 150 clients in this category, 32% (48) of them are open to evaluate other competing firms for future projects — which leaves too much at risk when competing firms are investing in CX at all time highs to ensure higher levels of positive client experiences.
- The firm is likely to lose 27 clients from a category of clients with no stated issues (150). That’s a projected 18% client turnover/churn rate at the cost of $6.7 million (not counting revenue replacement costs) even if the firm executes the project with no client-stated issues.
- Clients who have an unvoiced issue are nearly 50% likely (23.1 out of 50.3) to leave the firm. This is the opposite of loyalty. This means they experienced an issue and likely felt it wasn’t worth the effort to bring up to the firm. It is safe to say that this was less than a positive experience that is likely to result in their flight.
- Clients that either had no issue/complaint or had an issue that was satisfactorily resolved are prime for positive word of mouth, if activated properly.
- In terms of word of mouth, it’s no surprise that the two most risky category of clients are those who did not have an issue handled or it wasn’t handled to their liking. While this generally affects a smaller population (5.1 clients vs. 34.2 clients who did not voice an issue) the sentiment of their negative WOM is likely to be significantly more piercingly traumatic to the firm.
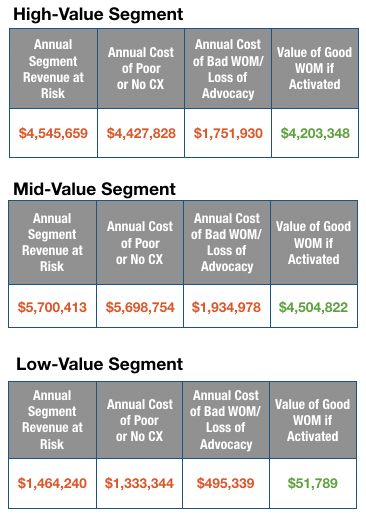
When you add these factors up, you will see significant impacts across all three segments. You will also see that in the case of this firm, the pain to address and gains to be made are fairly equally distributed across both the High-Value and Mid-Value segments. Counterintuitively, it makes sense for this firm to focus their CX investments on addressing unvoiced issues/complaints and activating positive WOM.
For most firms it is actually a forgone conclusion that if there is no investment in directly addressing client issues — and doing the important work to uncover unarticulated complaints the firm will experience a combination of unfavorable events affecting the top line, bottom line and employee morale and brand/reputation.

The bottom line is simple. Clients are always going to favor positive experiences. Whether you are planning for this through a systematic CX management program or not, there is a lot of work to do on the side of capturing and managing information about the experiences your clients have with your firm. If you’ve made it this far in the article (which is a long one) you are very likely one of those that is interested in figuring this out for your firm.
We are passionate about helping firms learn the subtle nuanced side of client experience. After all, there are often millions of dollars hidden in places you’ve not likely considered. If you think you can benefit from a more elaborated conversation around this topic, you should contact us at cxpilots.com or (833) CX PILOTS.
